Segment information and note breakdowns without PDF hunting
Preview period and context before insert
Single cells or bulk insert into your model
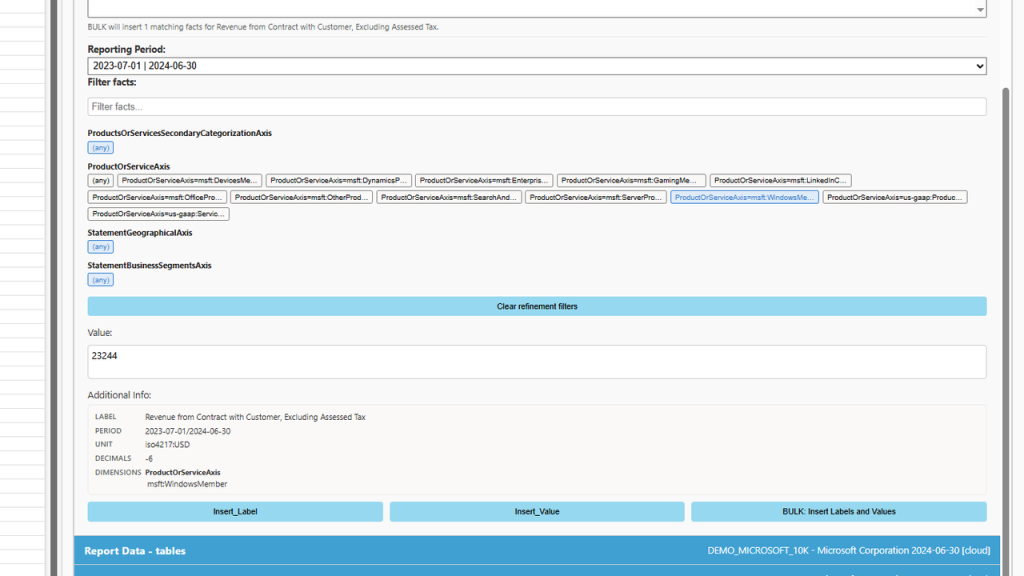
dimensional items / facet panel
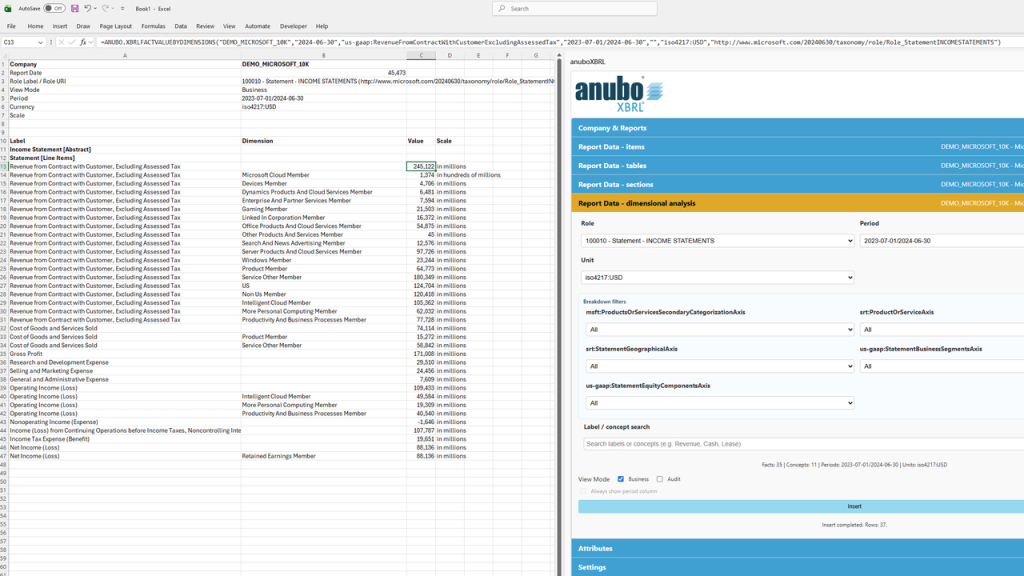
Dimensional Analysis
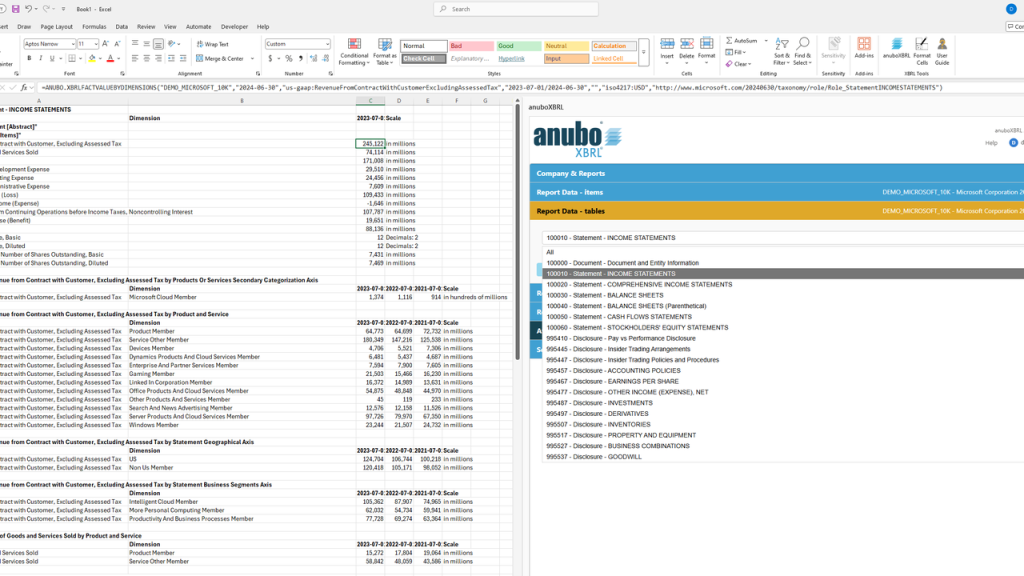
Note tables and roll-forwards — now in Excel
May 23, 2026
Issuers publish segment data, geographic revenue, statements of changes in equity, provision roll-forwards, and similar note schedules. These are familiar to analysts — but awkward to reuse in Excel.
New:Report Data – dimensional analysis — pick a disclosure table, filter by period, currency, and segment (or other breakdown), insert into your sheet.
What this enables
Segment P&L, revenue by region, equity bridges, provision movements
Filter before insert — not clean-up after
Live formulas in Analyzer; static values in Reader
dimensional analysis filters
Statement and note tables — now for ESEF/IFRS filings too
May 21, 2026
“Report Data – tables” has been part of anuboXBRL for US-GAAP work for some time. What is new: the table engine now follows the issuer’s presentation structure and pulls in segment, regional, and other breakdown lines — not only where US-style table definitions exist.
Why it matters
Many EU annual reports (ESEF/IFRS) use nested note layouts. Revenue by geography, segment information, statements of changes in equity, and provision roll-forwards (opening balance, additions, utilisation, closing balance) were often hard to get into Excel in a usable layout. They are now built from the same filing data — in presentation order, with breakdowns where the issuer disclosed them.
What this enables
Primary statements and familiar note-style tables for US and European issuers
Segment and regional lines alongside consolidated figures
Multi-period columns in one table — less manual reshaping
Live formulas in Analyzer; static values in Reader
Report Data – tables
Company-specific line items — visible at a glance
May 1, 2026
In many filings, the face statements mix standard line items with issuer-defined positions — extensions to the taxonomy that reflect how that company reports (extra P&L lines, cash flow subtotals, note-specific concepts, and similar).
New: choose a highlight colour for these company-specific line items, then use Format Cells on the ribbon. In the default setup, non-standard positions in your income statement or cash flow statement stand out from standard taxonomy lines — so you can spot where the issuer departed from the template.
You can also apply the same highlighting to other taxonomy extensions the issuer used, by selecting the relevant prefixes in Settings.
What this enables
Quickly see issuer-specific vs. standard line items in extracted tables
Consistent number formatting plus colour in one step
Configurable — choose which extension groups to highlight
anuboXBRL Analyzer Basic (US-GAAP / ESEF) is now available
March 11, 2026
Issuers in the US and the EU already publish structured financial data — mostly publicly available. Yet financial analysis often still depends on expensive data service providers.
Today we launch: anuboXBRL Analyzer Basic (US-GAAP / ESEF)
Analyzer Basic enables building financial models in Microsoft Excel directly on top of official EU-listed IFRS (ESEF) and US SEC EDGAR (US-GAAP / IFRS) inline XBRL filings.
These filings are structured, authoritative, and in most cases publicly available at no cost.
What this enables
Load EU-listed IFRS (ESEF) and US SEC EDGAR filings directly into Microsoft Excel
Keep formulas intact when switching companies
Avoid rebuilding models for new reporting periods
Maintain links between Microsoft Excel cells and their underlying XBRL concepts
Perform scalable KPI and time-series analysis
Stable financial models across companies and periods
Your model logic remains stable — only the reporting entity or period changes.
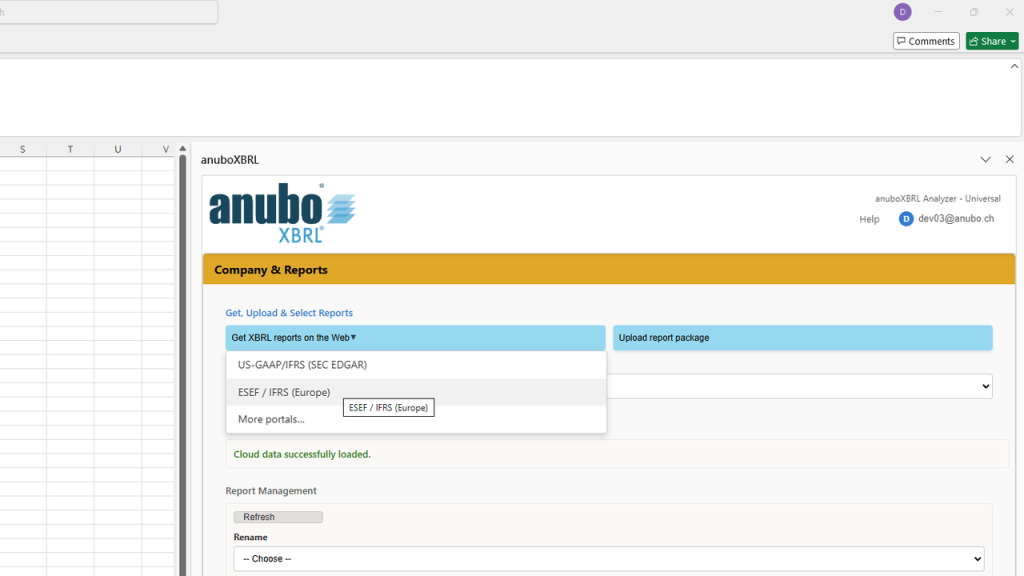
Get XBRL reports on the Web opens the filing portals you need — US SEC EDGAR and ESEF / IFRS (Europe) — from the task pane, without hunting bookmarks.
What this enables
Direct access to official US and European filing sources
Optional link to the download guide when opening a portal
Upload the package back into anuboXBRL when ready
More XBRL data portals from other regions will be added over time — integrated the same way, from the same menu in the task pane
“Get XBRL reports on Web”
We look forward to hearing from you via email request@anubo.com. This allows us to better respond to your request. We will reply as soon as possible – usually within the next working day.